17 Research sites
Today we’ll be doing an overview and survey on Group Project topics. There will be in-class time to work on your project.
17.1 Group Project Topics
- Air Quality Infographic - focused on PM2.5 and CO2
- PM2.5 Concentrations in and around Fontana and Bloomington
- PM2.5 Emissions sources in and around Fontana and Bloomington
- Spatial Visualization of Road Widening and Warehouse Growth in IE (or just one county - Riverside or San Bernardino)
- Socioeconomic Statistics of Riverside County Warehouses
17.2 Overview of the IQAir CCAEJ Redford Conservancy Monitoring Study
From the grant application, which is in Canvas.
CCAEJ will engage with the community of South Fontana/Bloomington to collaborate on an inclusive, community-centered planning process that can maximize the benefits of the real-time air monitoring data collection, analysis and advocacy steps. The planning process will involve participatory decision-making that promotes involvement and empowers a diverse segment of the populace, with a view of actively involving lower income populations and communities of color, empowering those most affected to shape the decisions that will impact their lives. Preliminary, mid-project and post-project semi-structured interviews will be conducted with residents (N:5-10) to identify understandings of pollutants and causes, and subjective experiences with air quality issues, the planning process, and advocacy efforts.
The Redford Conservancy will assist with data analysis and visualization, providing mapping in GIS, creating maps of areas as well as visualization of the findings of the research over the course of the grants. The RRC will work with CCAEJ and IQAir Foundation to tailor visualizations to appropriate public communication in both English and in Spanish. In addition, RRC will gather ethnographic data through interviews to round out local knowledge of air quality perceptions, understandings, and experience. Faculty and students will engage in research in both English and Spanish, translating findings into English.
Goals:
- Educate and empower identified community members living within the targeted area to recognize air quality issues in relation to their community and the consequential health risks.
- Develop a network of air quality monitors in identified communities to fill the air quality data gap within targeted areas.
- Generate data and a better understanding of air quality issues that the local community and regulators can use to spur enforcement or regulatory action.
- Use the information generated by the sensor network to improve community health by letting residents know when to limit their exposure in certain areas or during different times when air pollution is elevated.
17.2.1 Infographic Sources
- Air Quality Index
- Air Quality Communication Presentation
- Best Practices for Communicating sensor data
- IQAir Foundation
Next Tuesday we’ll cover Air Quality 101 as part of our lecture.
17.2.2 Concentrations of PM2.5 and CO2
- PM2.5 data sources include regulatory data and sensor data.
- IQAir API - requires registration and has limits.
- PurpleAir
- EPA AQS API - check Canvas, I will put all the PM2.5 concentration data for 2020-2024 for Riverside and San Bernardino Counties on there.
- NOAA GMD - also look at the way we pulled data in 1.5 and for methane in 12.2.5.
17.2.3 Emissions of PM2.5 and CO2
#fig-SCAQMD_EI shows the total emissions by source category.
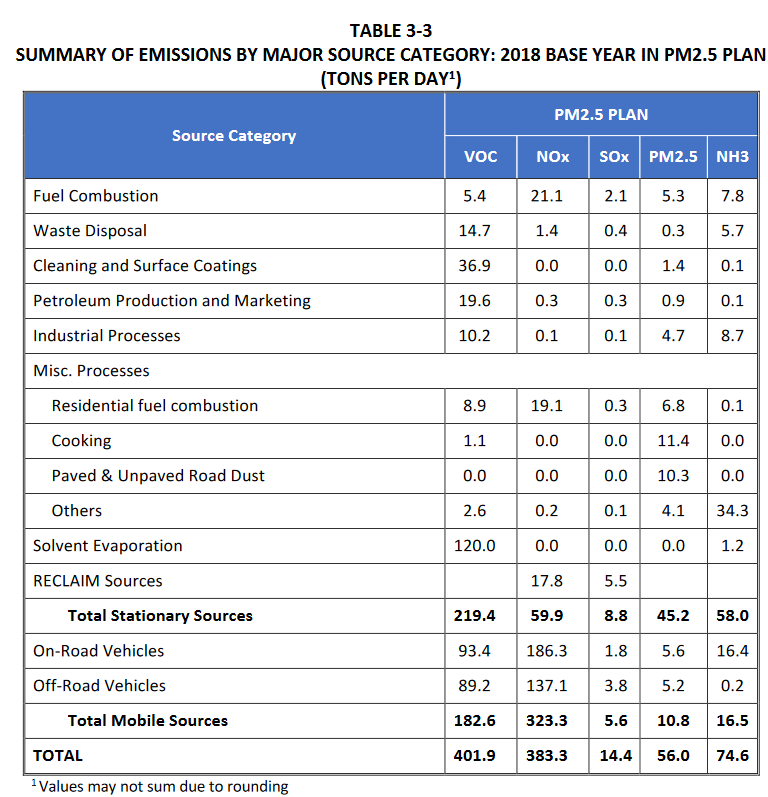
- SCAQMD PM Air Quality Management Plan Ch.3 Emissions Inventory
- SCAQMD Facilities
- EMFAC2021 on-road and off-road database
- Restaurants? I didn’t find a good open source dataset for restaurant info. There’s almost certainly a way to get this via OpenStreetMap. Needs more research.
- Roads and Rail - possibly from TIGRIS or from Caltrans
17.2.4 Road Widening Projects and Warehouse Data
- Riverside County
- San Bernardino County - check current, completed, planning, and under construction.
- See 10.3.2 for an example of the warehouse dataset.
17.2.5 Socioeconomic data
tidycensushas the most recent dataSoCalEJhas census block level socioeconomic data from 2015-2019.
17.2.6 Community Organization Data
- Coming Soon